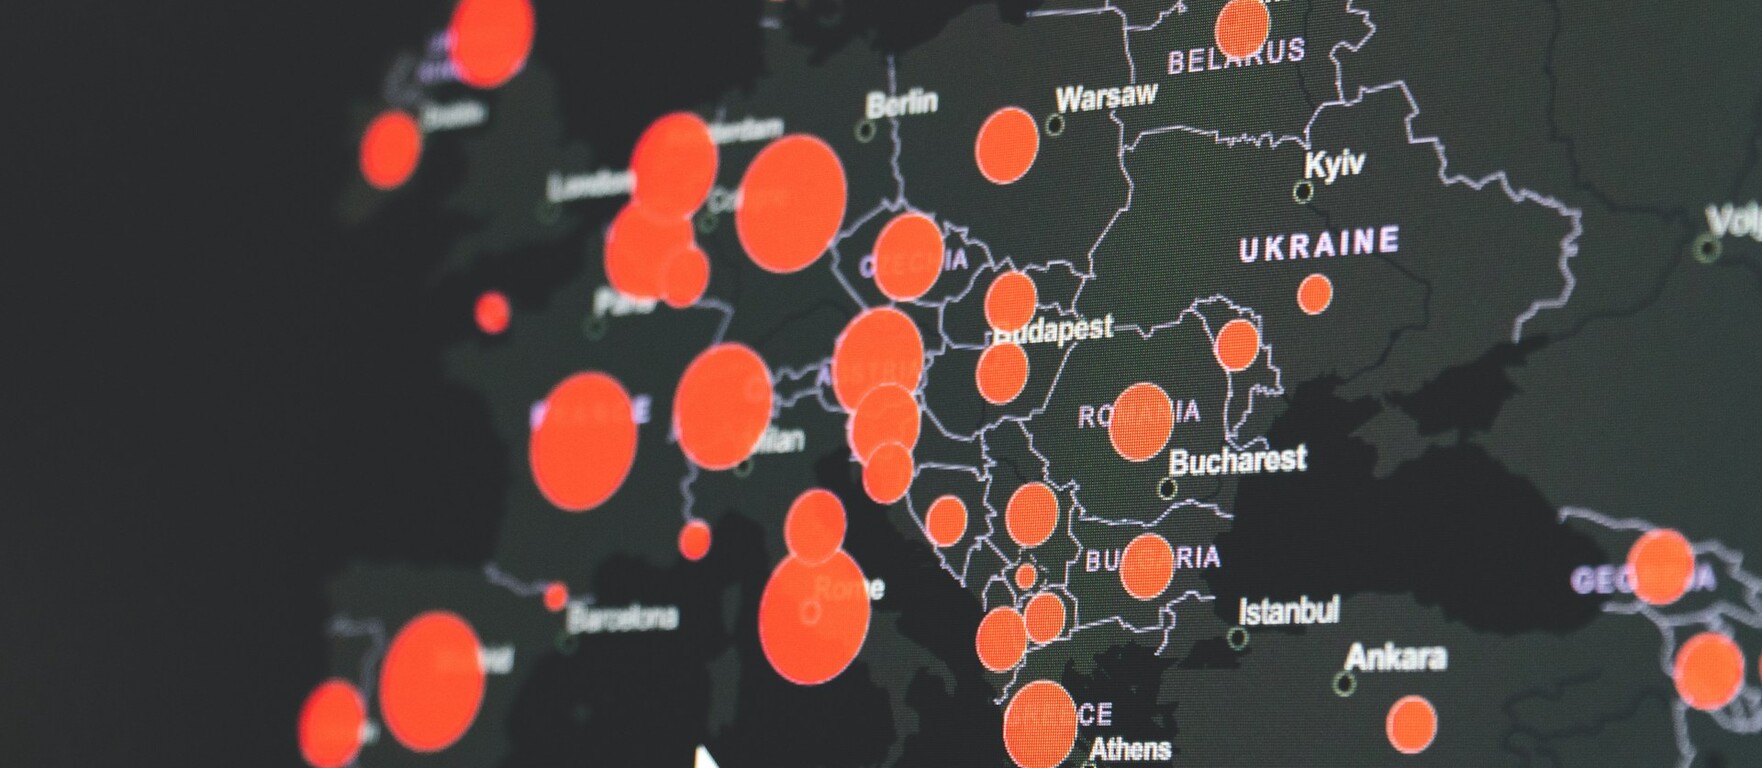
The regional data does not offer simple explanations for COVID's impact on life expectancy
16. 11. 2023 – Lomond
About seven months ago, we wrote a piece about the impact that COVID had had on life expectancy across Europe – with a particular focus on Central & Eastern Europe, where the impact was greatest (the 10 member states where life expectancy fell furthest from 2019 to 2021 were from the group of 11 CEE countries that joined the EU from 2004 onwards). It homed in one very simple (and maybe very obvious) ‘big picture’ factor which maybe hadn’t been given the prominence it deserved: countries’ relative wealth. It posited this as a conclusion: “perhaps, without wanting to underplay the complexities of all this or the importance of political decision-making, the truth is that wealthier nations were simply better able to cope with the impact of the pandemic than poorer countries?”
Regional life expectancy data has now been published by the European Commission and it’s an opportunity to dig into this further and see whether that hypothesis holds water.
You can break the numbers down to NUTS2 regional level, and, as you would expect given the national numbers, the vast majority of regions where life expectancy fell by two years or more between 2019 and 2021 are in CEE:

It’s worth pointing out that this chart does not include three of the four NUTS2 regions in Croatia (where the data is incomplete), or the French overseas territories (which were hit very hard by COVID).
The question is whether the different shades of red on this map shed any light on the impact of wealth on COVID outcomes – i.e. is there any evidence that, within countries, poorer regions suffered a larger drop in life expectancy during the worst of the COVID years than richer regions in the same country.
The evidence is mixed.
There are a few bits of evidence to support the hypothesis – for example:
The Czech Republic: Prague is comfortably the Czech Republic’s richest region based on GDP per capita; it also has the highest life expectancy of any of the NUTS2 regions in the country. Severozápad (Northwest) is the poorest region in the country, and has the lowest life expectancy (more than four years less than Prague). Between 2019 and 2021, life expectancy as a whole fell by 2.1 years in the Czech Republic, but outcomes were far worse in Severozápad (where life expectancy fell by 2.7 years, comfortably the biggest drop anywhere in the country) than they were in Prague (where it fell by 1.8 years).
Slovakia: Similarly, the Bratislava Region (Bratislavský kraj) is much wealthier than the country’s other three NUTS2 regions. Between 2019 and 2021, life expectancy in the Bratislava Region dropped by 2.2 years, well under the national average of 3.2 years. The largest drop was in the country’s poorest region, Eastern Slovakia (Východné Slovensko), where life expectancy fell by 3.7 years.
Hungary: As will be clear from the map above, the regional differences were not that marked in Hungary, but Budapest, the wealthiest NUTS2 region in Hungary by some distance, recorded the equal lowest drop in life expectancy between 2019 and 2021: exactly two years. The three worst affected regions were among the four poorest in the country: Northern Hungary (Észak-Magyarország), the Northern Great Plain (Észak-Alföld) and the Southern Great Plain (Dél-Alföld).
However, there is also evidence that doesn’t fit the hypothesis at all:
Romania: București-Ilfov is the wealthiest region in the country, and yet was hit the hardest by COVID, suffering a 3.3 year drop in life expectancy (versus a national average of 2.8 years).
Poland: The Warsaw metropolitan area (Warszawski stołeczny) suffered a drop in life expectancy of 2.7 years between 2019 and 2021, slightly higher than the national average. Three of the five poorest regions in Poland (those with GDP per capita below €11,000) suffered even more: Podlaskie (-3.2 years), Podkarpackie (-3.0) and Lubelskie (-3.0). However, outcomes were slightly better in the other two: Warmińsko-Mazurskie (-2.4) and Świętokrzyskie (-2.5). In Poland, there was a pronounced geographical split, with the regions down the country’s eastern border suffering more than those further west.
Bulgaria: The whole country suffered terribly during COVID, but Yugozapaden (Southwestern), the region that includes Sofia, is in the middle of the pack when it comes to the drop in life expectancy, a touch above the national average.
Greece & Italy: There are two regions in Greece where life expectancy fell by more than two years between 2019 and 2021: Central Macedonia (-2.4) and Thessaly (-2.3). While they are not wealthy regions by any means (in both cases, GDP per capita is just over €13,000), they are not the poorest parts of Greece either. Similarly, Molise, the only Italian region to make it on to the map above (-2.0) is the 17th poorest NUTS2 region in Italy out of 21, based on GDP per capita. The four poorest regions were all worse than the national average of 0.9 years, but still some way behind Molise.
So what’s the conclusion?
That issues this complex and multi-faceted almost never have simple, single factor explanations. It’s hard to look at the national figures and conclude that there is no connection at all between countries’ relative wealth and life expectancy falls in the worst years of COVID. But does that tell the whole story? Of course not.